
Model Confidence
My role
Product Designer
Research, Data Analysis, User Testing, Sketching, Iconography
What I did
About this project
ScienceIO uses AI to transform medical text into enriched datasets. Using our model, we wanted to show users how confident our model was with each identified medical term in the user’s uploaded document. The user could then approve or reject the medical label using their knowledge and our model confidence.
The Team
1
Designer
Engineers
3
Head of Product
1
Challenges
Accuracy Percentage
Our model provides us a number from 0.00.. to 0.99 depending on its confidence. But, what do these numbers mean? Without analyzing this data our confidence score would have little to no meaning.
First, we had to determine the accuracy percentage for a small range of results, 0.0 to 0.1, 0.1-0.2, 0.2-0.3.. and so on.
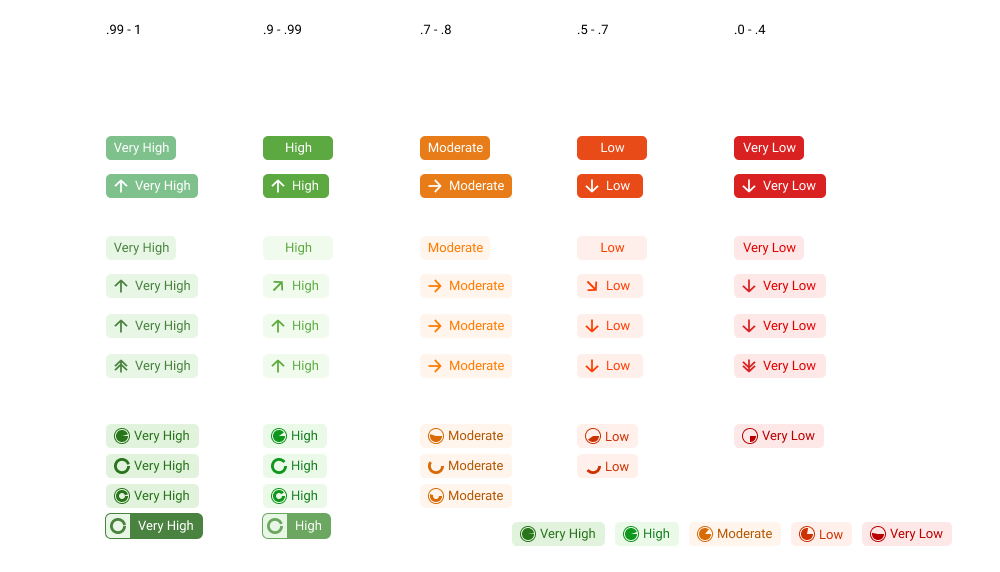
Confidence Scale
Once I had an accuracy percentage I could asses how to provide meaning to our categories (Very Low, Low, Moderate, High, and Very High). I assigned an accuracy percentage to each of these confidence categories that would resonate with users.
Label Distribution
Our model was extremely confident and very accurate. If we distributed the 0.0 to 0.99 scale evenly, then there would be almost no labels in the lower categories.
Solution

Once I had a range of expected accuracy per label I needed to distribute identified medical terms to provide meaning to our users. Below you will see the accuracy rate and distribution of labels across confidence categories. In some cases, we saw more accurate results in the “High” category than the “Very High” but this didn’t happen often enough to change our solution.
Early exploration
Final Component

Spotlight Widget
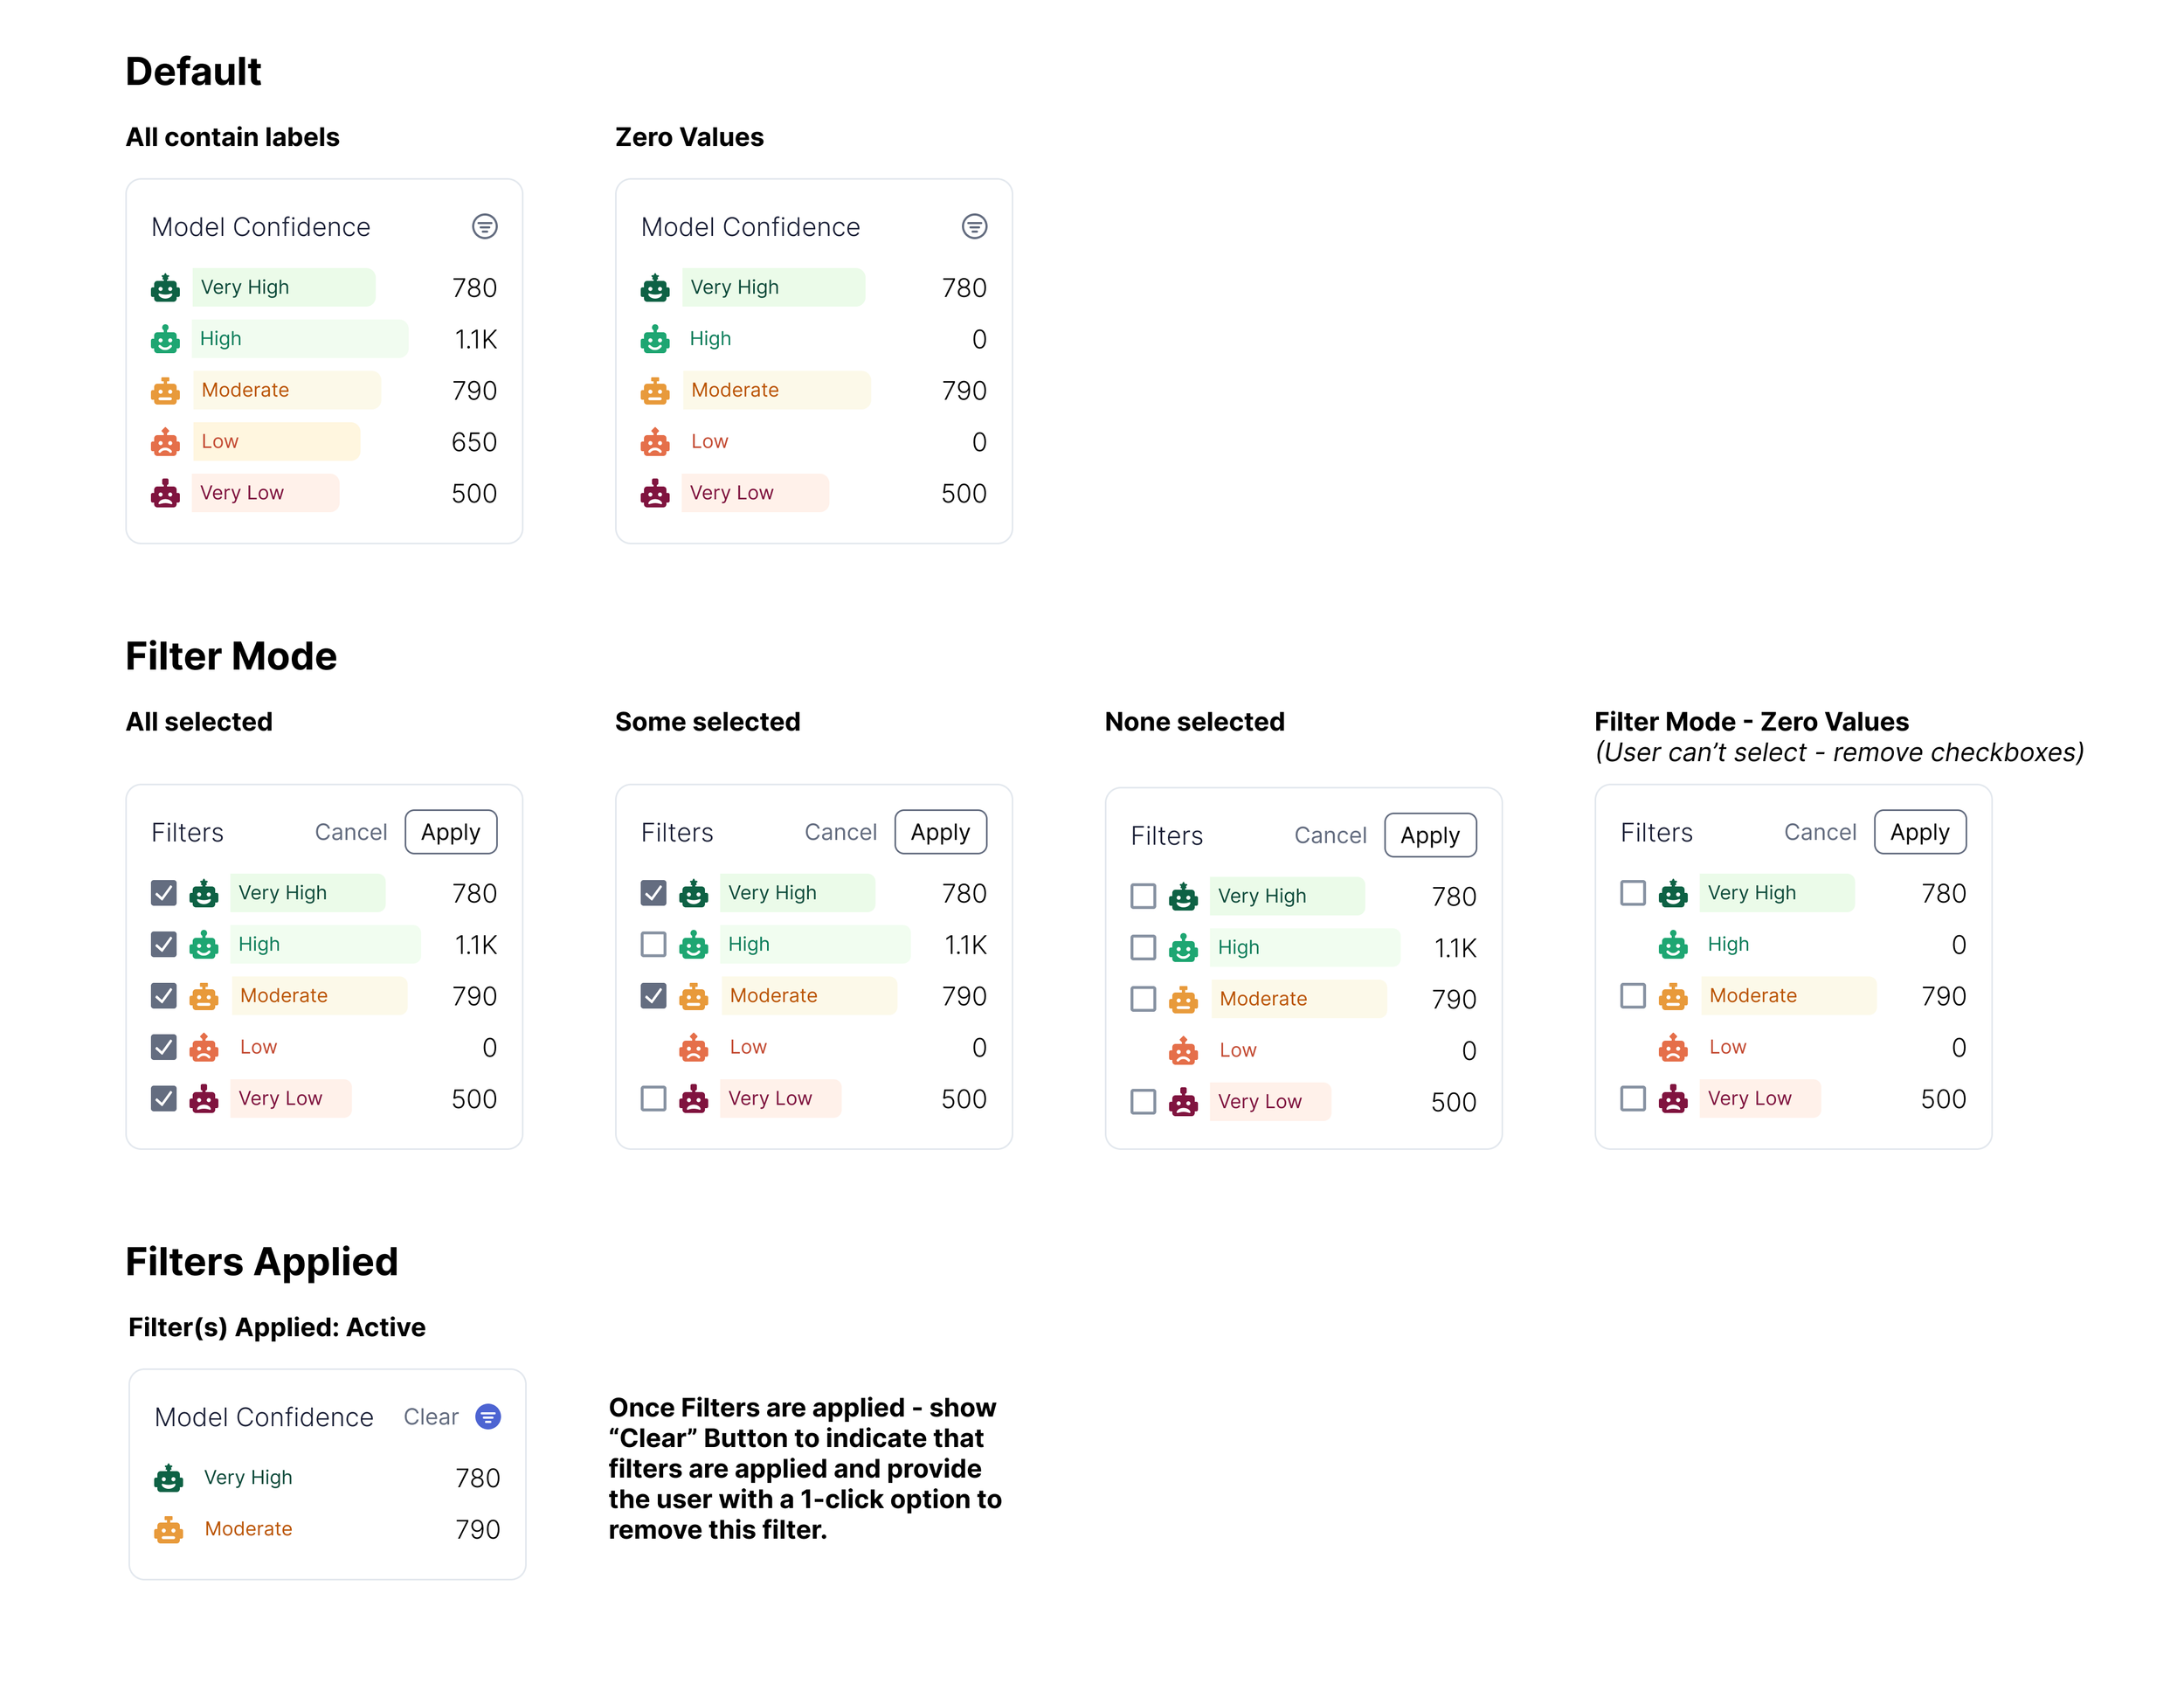
Used in the application to show the distribution of identified labels in the context of Model Confidence.